
In the digital world, Google Analytics has been a trusty map for over a decade, helping businesses of all sizes navigate the twists and turns of the online landscape. But maps need updating to stay useful, and that’s exactly what’s happening now. Google has rolled out Google Analytics 4 (GA4), the latest update to our indispensable navigation tool, signalling that it’s time for a change. For those using Universal Analytics 360, the enterprise version, the countdown has begun: after July 1, 2024, it will stop collecting new data.
GA4 is not just an update, but a complete overhaul of its predecessor. With Google making this change to its approach to tracking, analysis, and reporting, GA4 is set to become the backbone of data-driven decision-making for marketers, website owners, and data analysts alike.
Let’s delve into some features and practical benefits of the new Analytics.
Standout benefits of the new Analytics
A redesigned interface
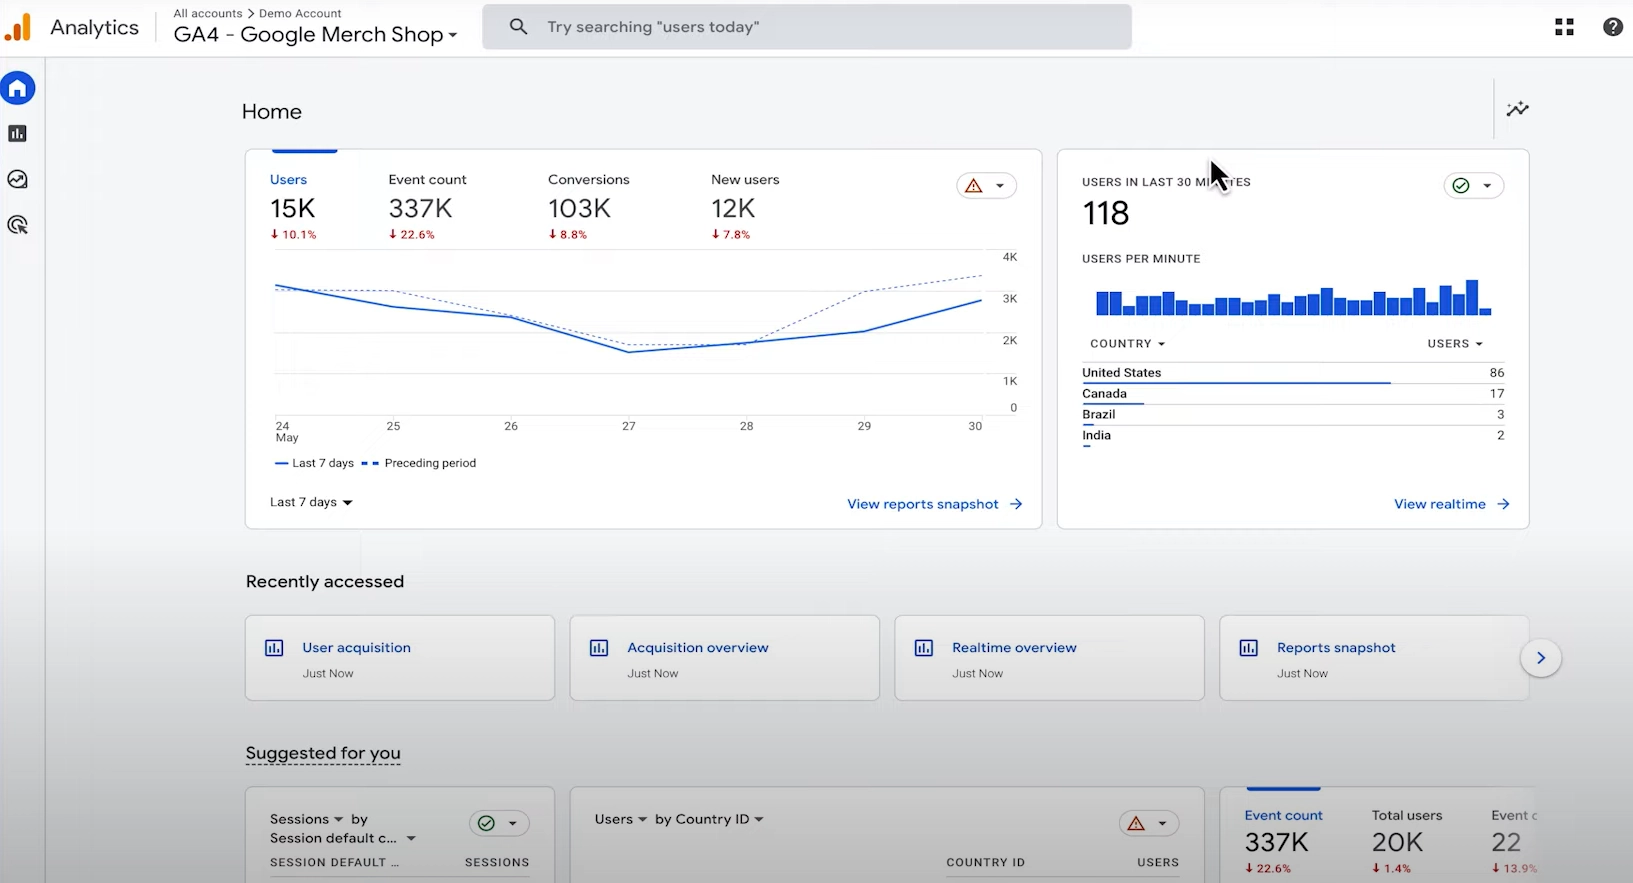
The GA4 interface has been reimagined to try and streamline navigation and make insights more accessible. This new interface is not just about aesthetics; Google pitches it as bringing forward the data points that matter most. Dashboards include real-time data, user acquisition reports, and engagement metrics. There are now different custom reporting features that allow users to drill down into the data landscape of their businesses.
Enhanced Google Ads integration
GA4’s integration with Google Ads goes beyond traditional tracking, offering a more granular view of how ad spend translates into user behaviour. With GA4, you can link multiple Google Ads accounts, allowing for seamless comparison and aggregation of data. The benefit is clear: marketers can now attribute conversions with greater accuracy, adjust campaigns on the fly, and understand the user journey from the first click to the final conversion.
Revolutionised metrics: the shift to events
Unlike UA, which relied heavily on session-based data, GA4 introduces an event-based model. This model doesn’t distinguish between hit types like page views, social interactions, or e-commerce transactions. Instead, every interaction is captured as an event, providing a unified metric system. The practical benefit is added flexibility to define and measure interactions that are unique to your site and your users’ behaviour.
At the heart of GA4 is the event-based model, which allows for granular tracking of any user interaction — this flexibility transforms how we approach event tracking. For example, a media site can now track metrics such as video playtime or article shares as primary events without the cumbersome setup that UA required. This leads to a deeper understanding of how users engage with content and can drive more informed content creation and distribution strategies.
Precision tracking and data reliability: funnel reports and beyond
One of the standout features of GA4 is the enhanced user tracking precision and data reliability, particularly evident in funnel reports. These reports are more sophisticated, allowing for the creation of complex funnels to track user journeys across your site or app. For instance, an e-commerce site can now analyse the path from product view to purchase in detail, identifying exactly where users drop off and allowing for optimisations to be made accordingly.
AdSense and GA4: monetisation meets metrics
The integration of AdSense with GA4 empowers website owners to track the performance of ads alongside user behaviour in a cohesive environment. With this integration, you can see how content engagement impacts ad revenue directly within GA4. A practical benefit is that content creators can pinpoint which articles or videos drive the highest ad revenue and tailor their content strategy to maximise monetisation.
Cross-platform tracking: the unified user journey
GA4 provides a unified view of the user journey across platforms. Whether your audience interacts with your brand through a mobile app or a desktop website, GA4 tracks this as a continuous journey. Practical benefits of this include the ability for businesses to analyse which platform is most effective in various stages of the customer journey. For instance, an app developer can ascertain if users prefer to browse products on the app but make purchases on the website, enabling strategic decisions on where to focus development and marketing efforts.
Google Analytics 4 is Google’s attempt at a leap forward for digital analytics — aiming to design a product that meets the growing needs of businesses in a digital-first world, with a focus on user-centric data, flexibility, and cross-platform analysis.
As UA sunsets and GA4 becomes the new standard, businesses will need to embrace its features to arm themselves with the insight to drive user engagement and business growth.
Can all my UA data be directly migrated to GA4?
Unfortunately not. Right now there’s no way to move your old data from Universal Analytics (UA) to the new Google Analytics 4 (GA4). The main reason for this is that both versions sort and understand data differently. It’s like trying to fit a square peg into a round hole — they just don’t match up.
So I have to set up GA4 from scratch? Is it difficult?
The short answer, unfortunately, is yes — and although GA4 can be plug and play, there are a few settings you might want to review to ensure it’s set up correctly:
- Data retention: Data retention settings determine how long data is kept before it’s automatically deleted. It’s crucial to align this with your business’s data governance policies and regulatory requirements. Keeping data for the right duration can serve historical analysis without compromising user privacy.
- Signals: GA4’s ‘Signals’ feature allows the integration of additional data such as CRM data, enabling richer, more informed user analysis. Ensuring that these signals align with your target audience’s attributes can enhance the accuracy of your reporting and predictions.
- Data stream: Your data stream configuration is the bedrock of your analytics — it tracks the flow of data from your websites or apps. Properly setting up data streams ensures accurate data collection and the integrity of the insights you derive.
- Built-in events: GA4 offers an array of built-in events that automatically track specific interactions on your site or app. Review these events and enable those relevant to your business objectives to capture critical user interactions without custom code.
- Integration with GSC and Ads: Integrating Google Analytics with Google Search Console (GSC) and Google Ads enhances your analytical capabilities. It allows you to see how your online presence translates into traffic and conversions and optimise your marketing efforts accordingly.
- Setting up custom dimensions and metrics: Custom dimensions and metrics let you track data that GA4 doesn’t automatically track. Setting these up is imperative for tailored reporting and deeper insights into the specific behaviour and performance metrics critical to your business.
Understanding the essence of the configuration tag
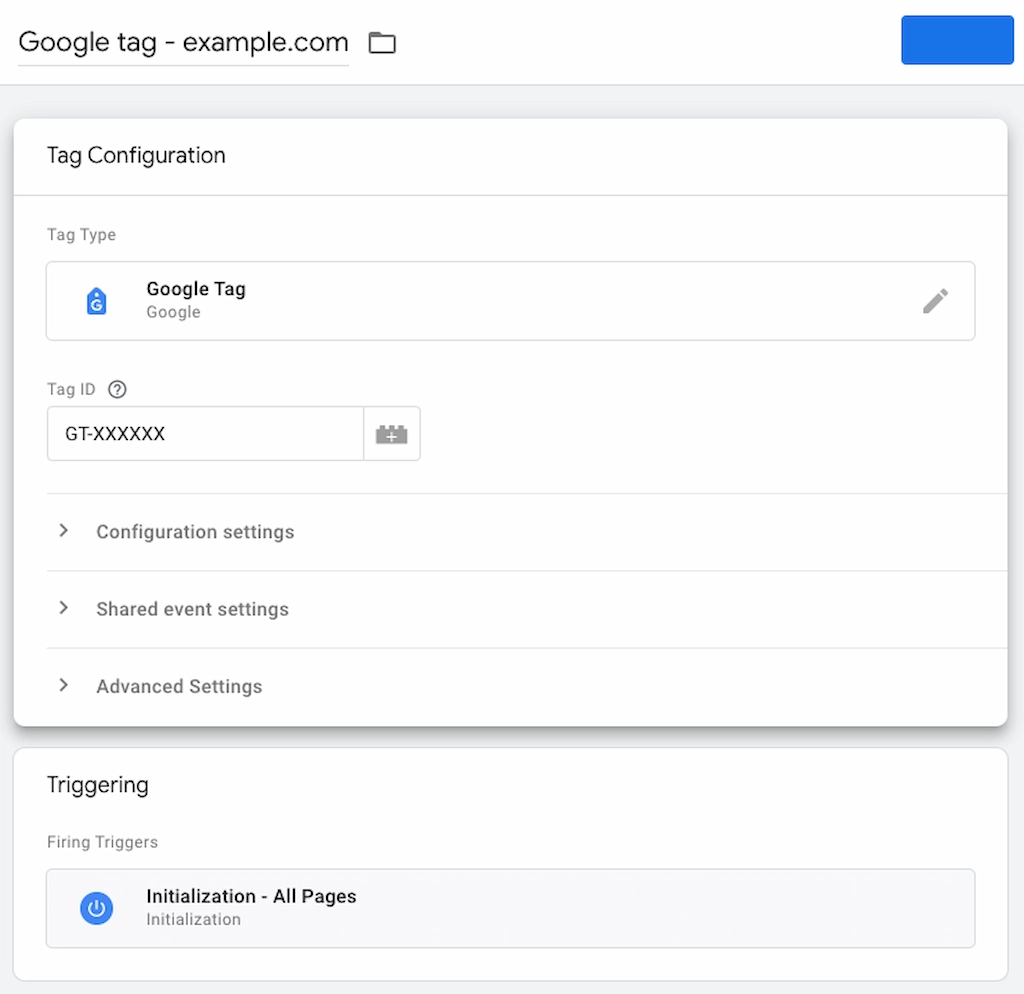
Image Source: Google
A configuration tag in GA4 is the linchpin of your analytics setup. It serves as the conduit through which data flows from your website into GA4, allowing you to track and analyse user interactions. When this tag is missing or incorrectly implemented, it’s like missing a crucial puzzle piece — your picture of customer behaviour will be incomplete.
With the evolution of Google Tag Manager, the process to address a missing configuration tag has become more streamlined. Here’s a roadmap to remedy the situation with clarity and precision:
01.
Verify the tag’s existence
Start by ensuring that the configuration tag is indeed missing. Use the ‘Tag Assistant’ by Google or the ‘GA4 Setup Assistant’ within Google Analytics to verify the presence of the tag.
02.
Access Google Tag Manager
If the tag is missing, access Google Tag Manager. Here, you can manage and deploy marketing tags (including GA4 configuration tags) without modifying the code on your website.
03.
Create or locate the GA4 property
Within Google Analytics, ensure you have a GA4 property set up — this property will generate the necessary configuration tag for your website.
04.
Generate the configuration tag in Google Tag Manager
05.
Set the trigger
06.
Test your tag
07.
Publish your tag
08.
Confirm data flow
Normal reports vs. explorer reports
Normal reports, often referred to as standard reports in GA4, are pre-configured reports that offer a quick, accessible view of your data across different aspects of your users’ interaction with your website or app. They are structured to give you an immediate glimpse into key metrics such as user engagement, demographics, technology used, events, and conversions.
These reports are designed to be user-friendly and are perfect for routine check-ins on performance. They feature:
- A predetermined set of data dimensions and metrics.
- A simplified view that’s great for quick assessments and overviews.
- Less flexibility in terms of customisation — but they are also less complex to use.
- Standard visualisation of data, which makes them very approachable for stakeholders at all levels.
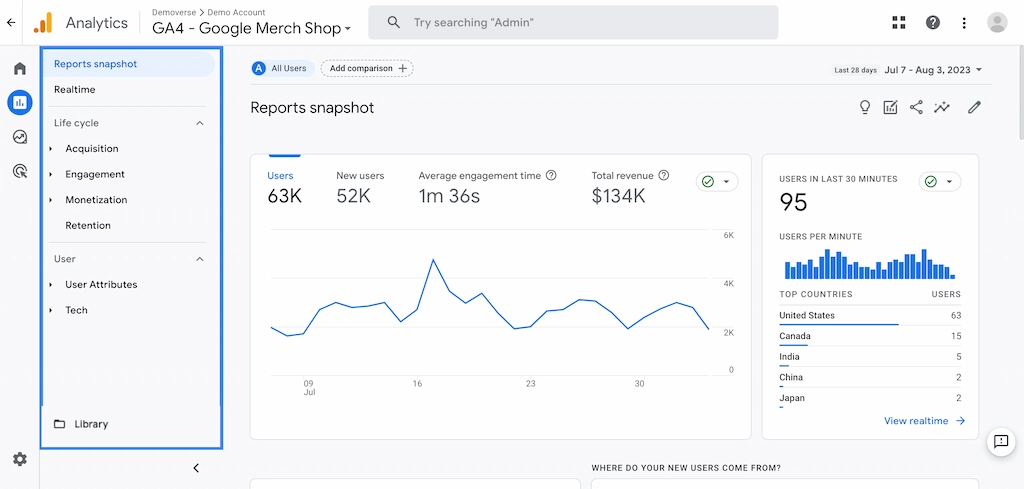
Image Source: Google
Explorer reports, on the other hand, are the GA4’s powerhouse of customisability and in-depth analysis. They are part of the ‘Exploration’ feature in GA4, which allows you to dive deeper into your data and uncover insights that are not immediately visible in normal reports — they offer:
- High customisability: You can mix and match a wide array of dimensions and metrics beyond what’s available in standard reports.
- Advanced segmentation: These reports allow you to dissect your data with fine-grain segments, analysing specific user behaviours and attributes.
- Complex analysis techniques: You can utilise techniques like cohort analysis, user explorer, path analysis, and funnel exploration to uncover user journeys and behaviours.
- Variety of visualisations: Beyond the standard bar and line graphs, you can create scatter plots, heat maps, and more, to visualise data in the way that best represents your analysis.
- Data comparisons: Explorer reports let you compare data across different user segments, date ranges, and other variables.
Explorer reports are much more flexible, for several reasons:
01.
Drag-and-drop interface
Building an explorer report is intuitive, with a drag-and-drop interface that makes the addition and manipulation of dimensions and metrics straightforward.
02.
Ad-hoc analysis
Explorer reports facilitate ad-hoc analysis, which means you can create reports on the fly to answer specific business questions without the need for predefined templates.
03.
Complex querying
You can ask complex questions of your data, such as how certain behaviours correlate with conversion rates over specific periods.
04.
Dynamic data
As you adjust parameters, the data is dynamically updated, providing instant feedback on your queries.
While normal reports are your go-to for everyday analytics, think of explorer reports as your analytical playground — a space where you can experiment and explore data beyond the boundaries of predefined structures. They provide the flexibility to dig deeper into the ‘why’ and ‘how’ behind the user data, enabling businesses to derive actionable insights that are tailored to their specific objectives and questions.
For analysts who wish to harness the full potential of GA4’s data analysis capabilities, becoming adept at using explorer reports is crucial. They bridge the gap between surface-level insights and the deep, nuanced understanding that can propel a business forward in a data-driven marketplace.
Need help with the switch to GA4?
At SIXGUN, our SEO team knows Google Analytics 4 inside and out. We’re here to make sure your business doesn’t miss a beat. We’ll handle the technical stuff, set you up on the new system, and show you how to get the most out of your data. With us, you’ll be able to keep your focus on running your business while we make sure you’re equipped with the best tools to understand your customers and grow your traffic.
We’ll dive into the core of your current systems, performing a comprehensive audit with meticulous attention to detail. Our commitment is to work closely alongside you, ensuring that every piece of data, every user interaction, and every strategic goal is translated and enhanced within the GA4 environment. Choosing SIXGUN means partnering with a team that values the precision of your data as much as you do. Book a discovery call with us now.
Hero Image Source: Canva